Contains modified Copernicus Sentinel data (2026). The dates link to the open scene records.
Lire le rapport en français
Ce que montrent les images
Entre le 31 octobre 2026 et le 10 novembre 2026, l’indice médian de végétation (NDVI) est passé de 0,133 à 0,118. Cette légère baisse invite à observer l’état du couvert végétal lors de la prochaine visite.
Quoi vérifier au champ
Irrigation
Si vous devez décider d’arroser, vérifiez l’humidité sous la surface et les pluies récentes. L’indice ne mesure pas l’eau dans le sol.
Champignons
Si des taches apparaissent après une période humide, photographiez les feuilles et faites identifier les symptômes avant de traiter.
Engrais et azote
Si des feuilles jaunissent, notez le stade de la culture et les apports récents. Une analyse de sol ou de feuilles aide à décider d’un apport.
Le cadre blanc délimite une fenêtre d’observation de 2,56 ha près du domaine expérimental d’Auzeville. Le calcul compare 256 pixels de 10 m valides sur les deux dates, sur 256 au total. Le NDVI utilise les bandes rouge (B04) et proche infrarouge (B08). La cause de la variation reste à vérifier au champ.
Leer el informe en español
Qué muestran las imágenes
Entre el 31 de octubre de 2026 y el 10 de noviembre de 2026, la mediana del índice de vegetación (NDVI) pasó de 0,133 a 0,118. Esta ligera bajada sirve para orientar la próxima visita y revisar el estado de la cubierta vegetal.
Qué revisar en el campo
Riego
Si necesita decidir si debe regar, revise la humedad bajo la superficie y las lluvias recientes. El índice no mide el agua del suelo.
Hongos
Si aparecen manchas después de un período húmedo, fotografíe las hojas y solicite la identificación de los síntomas antes de aplicar un tratamiento.
Fertilizantes y nitrógeno
Si las hojas amarillean, anote la etapa del cultivo y las aplicaciones recientes. Un análisis de suelo o de hojas ayuda a decidir si hace falta fertilizar.
El recuadro blanco delimita una zona de observación de 2,56 ha cerca del campo experimental de Auzeville. Se comparan 256 píxeles de 10 m válidos en ambas fechas, de 256 en total. El NDVI utiliza las bandas roja (B04) e infrarroja cercana (B08). La causa del cambio debe verificarse en el campo.
Satellite imagery shows vegetation change. WaPOR adds modelled water use and regional atmospheric demand. FarmOrbit brings the dates, sources and field questions together in one review.
Check the evidence
Verify source dates, usable coverage and native pixel sizes before interpreting a result.
Cross-check the water context
Match available WaPOR periods with the satellite window and consider imported field readings.
Choose the next field check
The AI agent selects from reviewed actions using the evidence and its gaps.
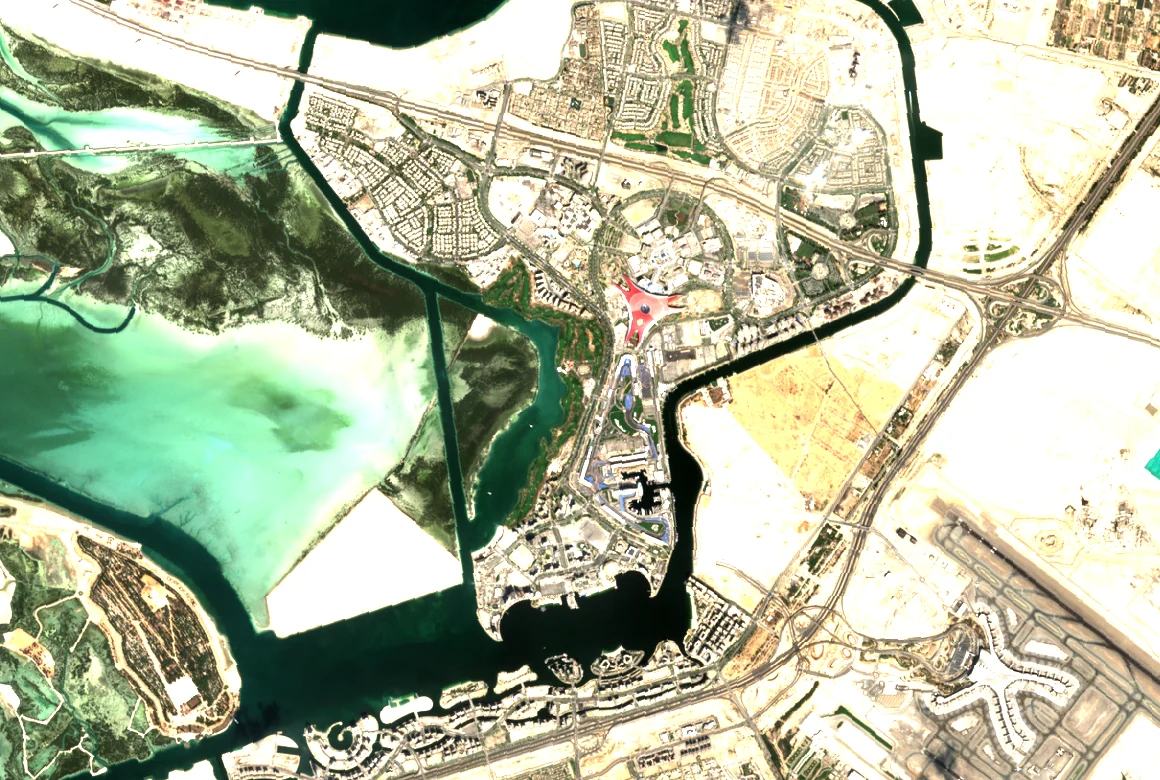
Sentinel-2 · Yas Island · 16 Nov 2026 · Wider context image
Golf · Arabic + English
From turf change to a water review
Combine the dated satellite finding with modelled evapotranspiration, identify missing meter or probe records, and give the course team a field check to review.
Read an excerpt · العربية / English
Doha demonstration window
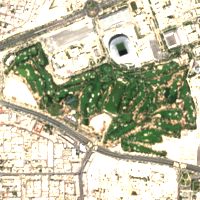
WaPOR actual ET including interception averages 0.545 mm/day, against reference ET of 5.100 mm/day, over 7 of 11 requested days between 4 and 14 November 2026.
Suggested check — confirm meter coverage, soil moisture and rainfall for the matched periods before adjusting irrigation.
منطقة توضيحية في الدوحة
بلغ متوسط التبخر النتحي الفعلي مع الاعتراض ٠٫٥٤٥ ملم/يوم، مقابل ٥٫١٠٠ ملم/يوم للمرجعي، خلال ٧ من أصل ١١ يوماً بين ٤ و١٤ نوفمبر ٢٠٢٦.
التحقق المقترح — تأكد من نطاق العداد ورطوبة التربة والهطول خلال الفترات المتطابقة قبل تعديل الري.
The figures describe a separate illustrative Doha window. The image shows Abu Dhabi. No client readings are included.
Review NASA OPERA vegetation disturbance alongside WaPOR water observations. The agent identifies the dated photos, plot boundary and land-use history needed for the next review.
Read an excerpt · العربية / English
Côte d’Ivoire demonstration window
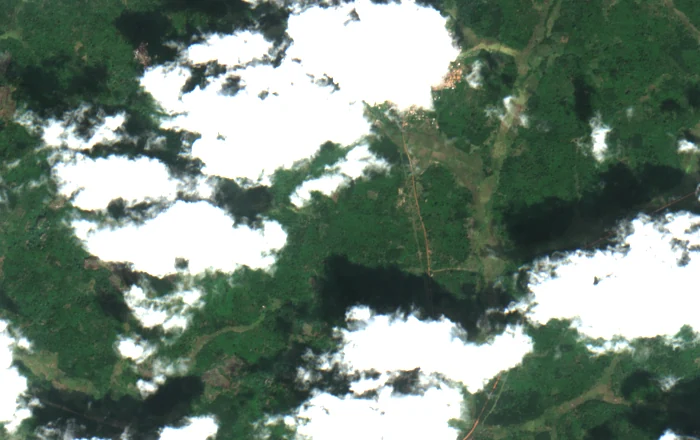
WaPOR actual ET including interception averages 2.651 mm/day, against reference ET of 3.780 mm/day, over 30 of 30 days from 6 October to 4 November 2026. The OPERA map dated 4 November has 62 active confirmed disturbance samples out of 2,916 valid samples.
Field review requires dated photos, the authorized boundary and land-use history to interpret the disturbance.
منطقة توضيحية في كوت ديفوار
بلغ متوسط التبخر النتحي الفعلي مع الاعتراض ٢٫٦٥١ ملم/يوم، مقابل ٣٫٧٨٠ ملم/يوم للمرجعي، خلال ٣٠ يوماً من أصل ٣٠ بين ٦ أكتوبر و٤ نوفمبر ٢٠٢٦. وتُظهر خريطة OPERA بتاريخ ٤ نوفمبر ٦٢ عينة اضطراب مؤكدة ونشطة من أصل ٢٬٩١٦ عينة صالحة.
يتطلب تفسير الاضطراب صوراً ميدانية مؤرخة وحدوداً معتمدة وسجل استخدام الأرض.
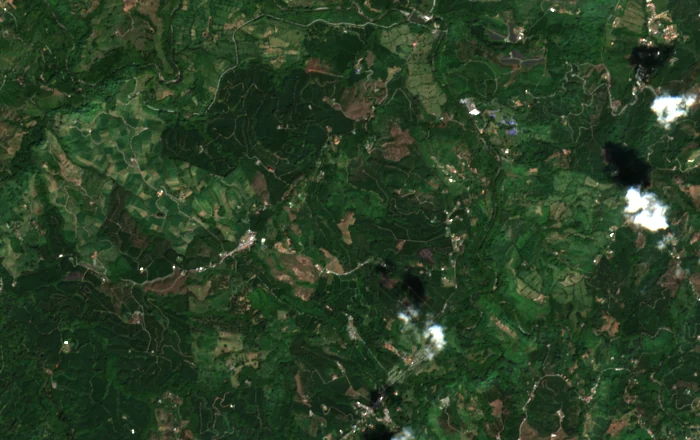
The figures describe an illustrative Côte d’Ivoire window. The image shows Colombia. A disturbance category does not establish deforestation, its cause or EUDR compliance.
Actual ET source cells are about 100 m. Reference ET is regional, about 30 km. Partial dekads use their whole-period daily mean. Water savings and better decision accuracy require field validation. Read the FAO source documentation.
Sentinel‑2 Level‑2A provides dated imagery. FarmOrbit compares valid pixels across both dates and links each observation to the source catalogue.
AI support, field judgment
The agent uses the computed vegetation and coverage metrics to select a field check. Site teams interpret possible causes and decide whether to intervene.
Private pilot workspaces
Invited teams have separate workspaces. The public demo uses open imagery. Golf and cooperative workflows can incorporate authorized site data during a pilot.
Google Earth and FarmOrbit
Google Earth · Explore a site
Locate a site, draw and measure a boundary, and browse available historical imagery.
Compare the same usable pixels across dated acquisitions, link the finding to field records, and save the next action for the team. The free plot scan covers a single location. The paid pilot applies the workflow to a team’s own operating question and records.
What a paid pilot would test
Golf · Which zones should we inspect first?
In the Doha example, median vegetation index moved from 0.798 to 0.701 on 986 matched Sentinel‑2 pixels. The report aligns those dates with a sample probe and irrigation meter log. Riyadh and Abu Dhabi show how the same method can be used across courses.
The imagery is real. The field readings are synthetic and the boundaries are illustrative. The example establishes no water savings or cause for the change.
US$1,000 golf pilot. One course, one operating question and up to three zones. Compare inspection time, actionable findings and false alerts with the team’s normal process.
The coffee and cocoa examples use Landsat-derived data. FarmOrbit flagged 6 of 3,600 land pixels in the Colombia test window and 62 of 3,600 in Côte d’Ivoire for mapped tree-cover loss during 2021–2025.
These are demonstration windows. A flag identifies something to review. The reviewer needs the authorized boundary and land-use history to interpret it.
Cooperative pilot. Run the review on ten authorized cases per partner and compare time per case, follow-up requests and first-review acceptance.